
Risk Diagnostics
How We Quantify Systemic Risks
We quantify risk to help reveal where the problems are in public finance systems and to help track progress over time. We also use it when measuring the costs of corruption and other inefficiencies from having weak public finance systems.
The methodology we use to measure systemic risk is nothing new. We’ve been using it since 2009 when our director, Andrew Laing, first applied it in a Technical Working Paper on Sub-national Strategy Financing in Papua New Guinea. He was then the Assistant Director General of the Economics and Service Delivery Branch in AusAID (Australia’s former aid agency). The paper was the first Development and Fiduciary Risk Assessment that focused on balancing the trade-offs between the fiduciary and reputation risks of working in and using weak country systems, and the development risks of not strengthening systems to deliver efficient, effective and sustainable development outcomes.
The same methodology has been applied in other risk assessments since then including Afghanistan, Ghana, Iraq, Ireland, Liberia, Puerto Rico, Sri Lanka, Timor-Leste, Tokelau, Turks and Caicos Islands, United Nations Relief and Works Agency (UNRWA, including West Bank and Gaza, Syria and Jordan), Vietnam, and Zambia.
the Three Steps to Quantify Risk
Step 1
Convert Alpha Scores to Numeric
Use the basic scoring alogorithim of D=1 A=4..
Step 2
Apply Risk Factors (weights)
Apply the quantification formula (performance x weight)
Step 3
Convert Raw Score to 0-1 index.
Apply standard re-indexing formula to 0-1 base.
The Methodology for
Quantifying Development and Fiduciary Risk

Creating the Index
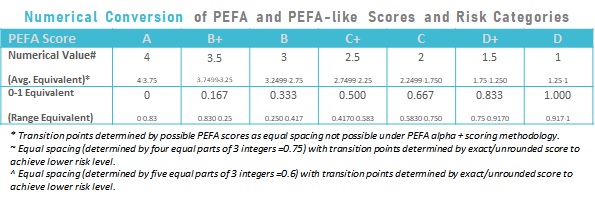
A range of financial accountability performance indicators (based on the Public Expenditure and Financial Accountability Assessment methodology) are converted to numerical values in line with common approaches (including in frequent Fiduciary Risk Assessments (FRAs) and PFM system analysis undertaken by DFID, PEFA country and inter-temporal comparison reports by the World Bank, the IMF PEFA index[1] and Delorenzo[i]). Generally, these are around quality of systems of fiduciary risk. Numerical grade conversions are as follows: A=4, B=3, C=2 and D=1, with + scores given an additional 0.5. These are summarized in Table below along with the two different approaches to categorizing financial accountability: i) a five tiered system, which assigns a moderate rating around the central score of C+ (2.5); and ii) Zero-to-one (0-1) scale (useful for cost-effectiveness analysis).
[1] The IMF PEFA index uses PEFA ratings for the main 28 components and are based on an ordinal scale (A to D) and are converted into numerical values and then aggregated using equal weights. Therefore, PEFA scores (A,B,C,D) are converted into the four ordinal to numerical scores (4,3,2,1) – to assist with graphing results – , with “+” score given ½ point and assign equal weight to each of 28 government PFM indicators. Non-Rated (NR) and/or Non-Used indicators are not used in the calculation. 77
[i] De Renzio, P. (May 2009). “Taking Stock: What do PEFA Assessments tell us about PFM systems across countries?”. ODI, Working Paper 302. London, UK. Retrieved from: https://www.odi.org/sites/odi.org.uk/files/odi-assets/publications-opinion-files/4359.pdf
Under our approach risk factors are assigned for each performance indicator and dimension based on the assessed importance to accountability and applied the following numerical equivalents: High = 3, Moderate = 2 and Low = 1. A crucial point here is that risk factors for PI dimensions can be different. For example, medium term policy linked budgets are more important for development risk than say for fiduciary risk so would get a higher risk factor, while bank reconciliation systems are more important for short term fiduciary risk so would get a higher fiduciary risk factor. The nominal scores are rebased to a 0-1 range to give more meaningful numerical values to risk levels, but importantly also enables wider use including in cost-effectiveness analysis of aid interventions and reform programs (see use in Multi-Donor Trust Fund decision analysis[i]). Other approaches have also been adopted for rating fiduciary risk including the French Fiduciary Risk Index (FRI), which is simply a reduced PEFA set[1], [ii] and [iii]; the IMF PEFA Index. Risk factors are available on request.
[1] The French FRI – FRI calculation is indicative. The FRI is obtained from the scores of 12 selected PEFA indicators, divided in 4 dimensions: D1 – Credibility of the budget: PI2; PI4; PI7; D2 – Effective enforcement procedures and expenditure control: PI18; PI19; PI20; D3 – Reliability of accounting and financial reporting: PI22; PI24; PI25; and D4 – Quality and external audits: PI26; PI27; PI28. Each score for the 12 indicators is converted into digital score via a conversion table. The FRI is obtained by simple average of the ratings of the twelve digital scores. Besides the overall rating, each dimension score is obtained by average ratings of the three digital scores related to this dimension. An overall score is assigned and associated management system of public finances in four risk categories: low (A), moderate (B), high (C) and high (D). Beyond the overall index, four (PI18; PI19; PI20; PI26) out of twelve indicators must have minimum thresholds in order that the fiduciary risk must not be considered as very high. This principle is supposed to limit the effects of compensation between ratings.
[i] Laing, A. (2012). “Economic Appraisal: Somalia Stability Programme”. DFID. London, UK.
[ii] Bessette, F. (2009). “The French Doctrine on Fiduciary Risk”. IMF PFM Blog. Retrieved from: http://blog-pfm.imf.org/pfmblog/pfm_blog/
[iii] PEFA Secretariat. (2009). “Survey of PEFA Partners’ Use of PEFA Assessments for internal processes”. Retrieved from: https://pefa.org/research-impact/survey-pefa-partners-use-pefa-assessments-internal-processes

Some issues
There are recognized problems with averaging PEFA scores. De Lorenzo (2009) pointed out that “the PEFA methodology actually measure very different things” and that the “use of averages is based on the assumption that all indicators are equally important”. He went on to explain that “this might be problematic for a number of reasons. For some parts of the framework, for example, some indicators may actually be ‘more important’ than others”. This is particularly relevant for fiduciary risk analysis. Simple averaging of numerical PEFA scores does not consider indicators or dimensions that are more important to fiduciary risk than other.
Other problems with averaging PEFA scores include issues concerning the addition of a plus (+) to Performance Indicators under the M1-weakest link and M2-averaging methodologies for PEFA themes. For example, adding 0.5 for a plus may not be as sensitive to system quality. Under M1-weakest link approach, a four-dimension indicator could receive 3 A’s and 1 D and therefore secure a D+, or 3 D’s and one C and also get a D+. The system with 3A’s and 1 D could be considered superior to the other, but both get the same score. An approach to this problem would be to assign some variability in the range of M1 scores around 0.5 that would account for relative strengths and weakness. Under the M2-averaging approach, Performance Indicator (PI) dimensions are basically assessed as being equally important to the PI. For M2 scoring, analysts could use the actual average scores for M2 scores. This is problem is not significant on the basis that PEFA represents expert opinion on system quality so a 0.5 assignment for a plus is not inappropriate. Consequently, for this paper, 0.5 was added for any PEFA PI with a plus.
Another problem emerges when assigning ranges and transition points for category changes (e.g. from B+ to A, from low risk to moderate risk. When assigning a PEFA equivalent score to an average of different PIs (like for the 7 PEFA themes or all 31 indicators), numerical scores are unlikely to fit neatly in the range of possible PEFA PI scores for any single PI (see Table 2 and Table 3[1]). Consequently, ranges need to be assigned for alpha-plus scores. It is not possible to use equal spacing to numbers between 1 and 4 and still be consistent with possible alpha-plus PEFA scoring (see Table 2). The results are that A and D have half (0.25) the numerical range as the rest (0.5) (see Table 1). The result occurs simply because there is not an A+ and E+ to secure the equal spacing, while alpha-plus PEFA scores still represent midpoint scores. For inter-temporal same country comparisons, same year cross country comparisons, and inter-temporal, cross-country comparisons it is important to ensure that the same ranges are followed to ensure the robustness of findings.
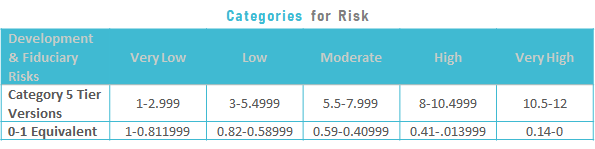
Problems also emerge when assigning a risk category rating based on average PEFA scores. The question is what are the transition points for moving from one risk category to another – e.g. from moderate to substantial? There are two basic options: i) use an equal spacing rule for a 1-4 numeric scale; or iii) use a non-equal spacing rule (e.g. a 7-tier rule equivalent to PEFA numeric spacings or arbitrary spacings determined by expert opinion). The equal spacing rule is generally applied.
[1] The Grading Algorithm Table above shows all the possible PI-plus scores under PEFA while Table 30 shows PEFA conversion tables with numerical equivalents. It should be noted that the use of the first box of Table 30 as a lookup table works for assigning pluses based on numerical averages for 2, 3 and 4 dimensions under M2 PIs in accordance with PEFA conversion tables.